National Industrial Real Estate Statistics & Highlights
We’ve broken the national industrial real estate market summary into 4 main categories: market inventory, market construction, market rent, and market vacancy & net absorption nationwide.
National industrial real estate market expert insight:
While vacancy levels have slightly increased, industrial lease rates across the US have remained healthy for landlords in the larger markets with the overall average even increasing.
Chicago’s Industrial market, which is consistently ranked within the top 3 market across the US insofar as inventory and overall size, continues to see premium lease rates and in some cases record breaking facility and/or land sales”
– Mike Hawryluk, Managing Principal, ICG CRE
First, let’s take a quick look at The United States industrial real estate market lease stats.
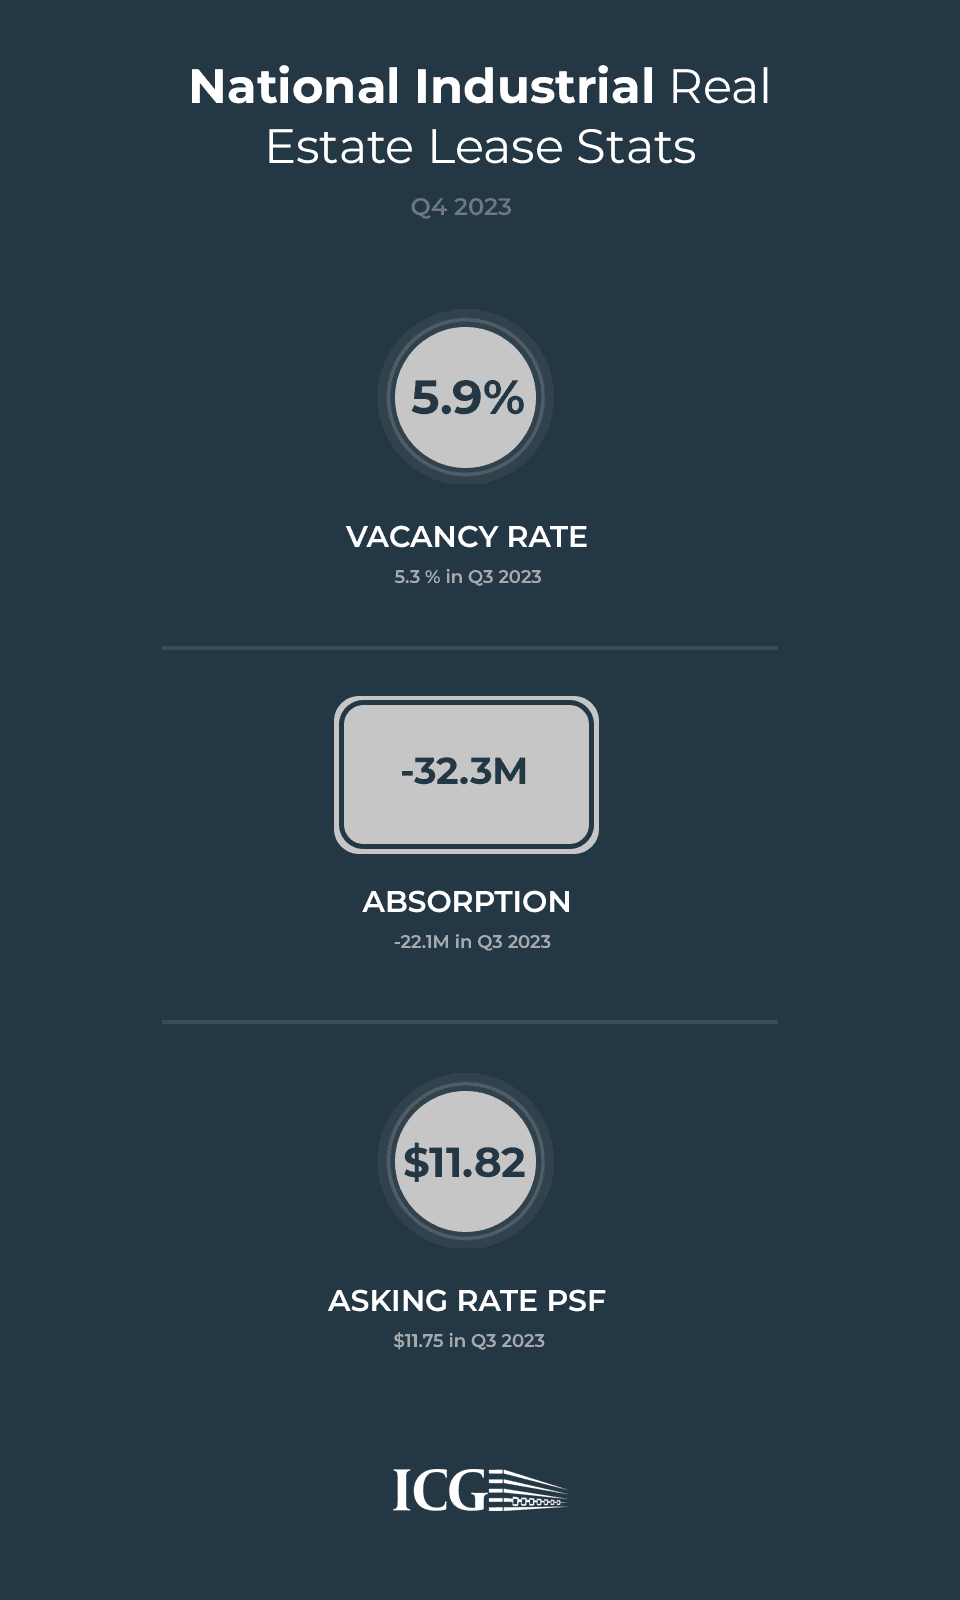
National Industrial Real Estate Lease Stats – Q4 2023
Vacancy: 5.9% (5.3 % in Q3 2023)
Absorption: -32.3M (-22.1M in Q3 2023)
Asking rate PSF: $11.82 ($11.75 in Q3 2023)
National Industrial Leasing Stats (Past 12 Months)
12 Month Deliveries in SF: 524M
12 Month Net Absorption in SF: 128M
Vacancy Rate: 5.9%
12 Month Rental Growth: 6.1%
Industrial Real Estate Stats By Largest Metropolitan Areas in the USA
We’ve highlighted the top 5 metro regions in The United States: New York, Los Angeles, Chicago, Dallas, and Houston industrial real estate to show a broad scope of where these markets stand for various industrial statistics.
Industrial Market Inventory in Top 5 Metro Regions of USA
The stats below highlight the industrial real estate market inventory compared to all markets across the country.
1. New York, NY
Industrial Buildings / Assets: 24,780
% of US Inventory: 4.7%
Rank: 4
2. Los Angeles, CA
Industrial Buildings / Assets: 35,502
% of US Inventory: 5.1%
Rank: 3
3. Chicago, IL
Industrial Buildings / Assets: 25,796
% of US Inventory: 7.5%
Rank: 1
4. Dallas, TX
Industrial Buildings / Assets: 24,338
% of US Inventory: 6.0%
Rank: 2
5. Houston, TX
Industrial Buildings / Assets: 24,494
% of US Inventory: 4.3%
Rank: 6
Industrial Real Estate Under Construction Stats in Top 5 Metro Regions of USA
The stats below highlight the industrial real estate under construction stats compared to all markets across the country.
1. New York, NY
Industrial Buildings / Assets: 88
Pre-Leased %: 29.1%
Rank: 88
2. Los Angeles, CA
Industrial Buildings / Assets: 40
Pre-Leased %: 19.1%
Rank: 40
3. Chicago, IL
Industrial Buildings / Assets: 71
Pre-Leased %: 34.2%
Rank: 51
4. Dallas, TX
Industrial Buildings / Assets: 237
Pre-Leased %: 32.9%
Rank: 54
5. Houston, TX
Industrial Buildings / Assets: 219
Pre-Leased %: 34.0%
Rank: 52
Industrial Real Estate Rent Stats in Top 5 Metro Regions of USA
The stats below highlight the industrial real estate rent / lease stats compared to all markets across the country.
1. New York, NY
Rent / SF: $19.56
Rank (Rent / SF): 7
12 Month Market Rent Growth: 6.1%
Rank: 48
2. Los Angeles, CA
Rent / SF: $19.09
Rank (Rent / SF): 8
12 Month Market Rent Growth: 2.9%
Rank: 93
3. Chicago, IL
Rent / SF: $9.41
Rank (Rent / SF): 48
12 Month Market Rent Growth: 6.1%
Rank: 46
4. Dallas, TX
Rent / SF: $9.46
Rank (Rent / SF): 47
12 Month Market Rent Growth: 7.8%
Rank: 20
5. Houston, TX
Rent / SF: $8.93
Rank (Rent / SF): 51
12 Month Market Rent Growth: 4.9%
Rank: 59
Industrial Market Vacancy & Net Absorption in Top 5 Metro Regions of USA
The stats below highlight the industrial real estate vacancy rates and net absorption compared to all markets across the country.
1. New York, NY
Vacancy %: 6.0%
Rank: 67
12 Month Absorption: -4.6M
Rank: 99
2. Los Angeles, CA
Vacancy %: 4.6%
Rank: 44
12 Month Absorption: -17.7M
Rank: 100
3. Chicago, IL
Vacancy %: 5.2%
Rank: 57
12 Month Absorption: 14.1M
Rank: 3
4. Dallas, TX
Vacancy %: 8.5%
Rank: 90
12 Month Absorption: 29.6M
Rank: 1
5. Houston, TX
Vacancy %: 6.9%
Rank: 83
12 Month Absorption: 18.9M
Rank: 2
If you’re interested in finding out more about The United States’ commercial real estate market and keeping up to date on what’s going on, check out our Industrial CRE News page for the latest highlights and transactions.
Sources of Data: ICG CRE & CoStar